

See your web estate
At a glance
Build live, map-based dashboards in minutes - from traffic and performance to conversions and security events - and give every stakeholder exactly the view they need.
From raw data to shared understanding - instantly
Give stakeholders real-time, map-based dashboards that make patterns obvious and action immediate.
Drag-and-drop dashboarding
Create stunning dashboards with simple drag-and-drop. Add widgets for traffic, performance, conversions or security and publish in minutes.
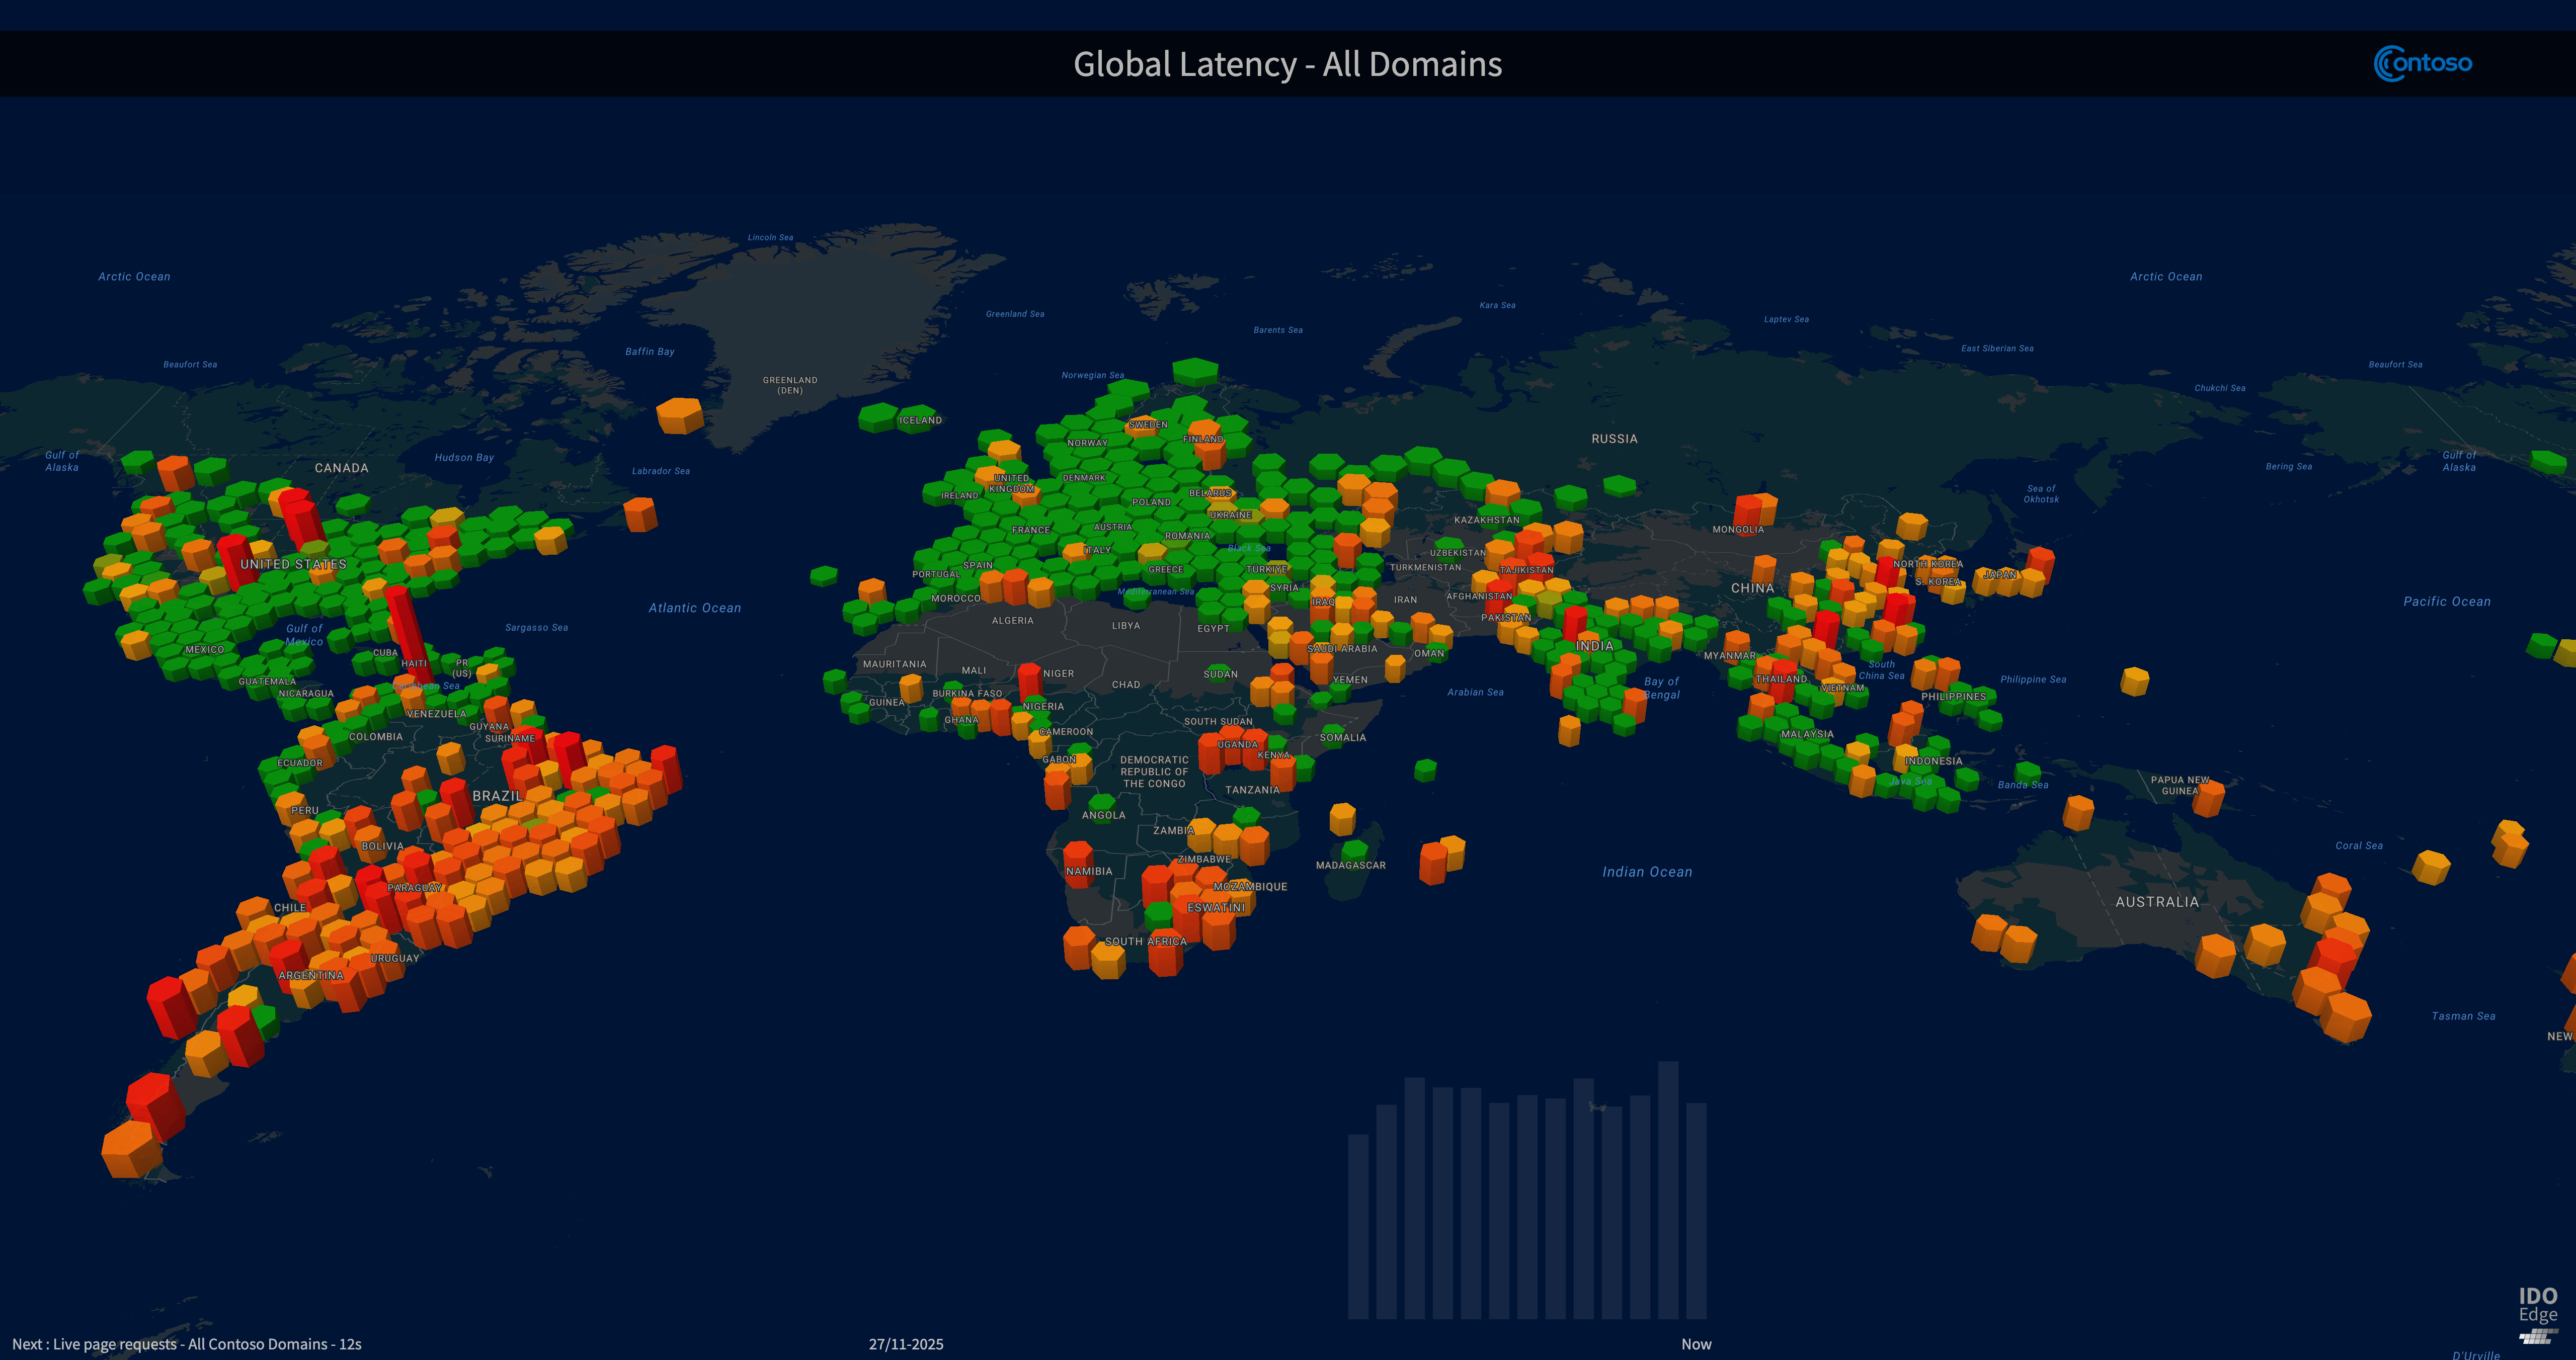
World-map views
A global map that shows where events are happening - from user sessions to errors and firewall interceptions - with time-window filters.
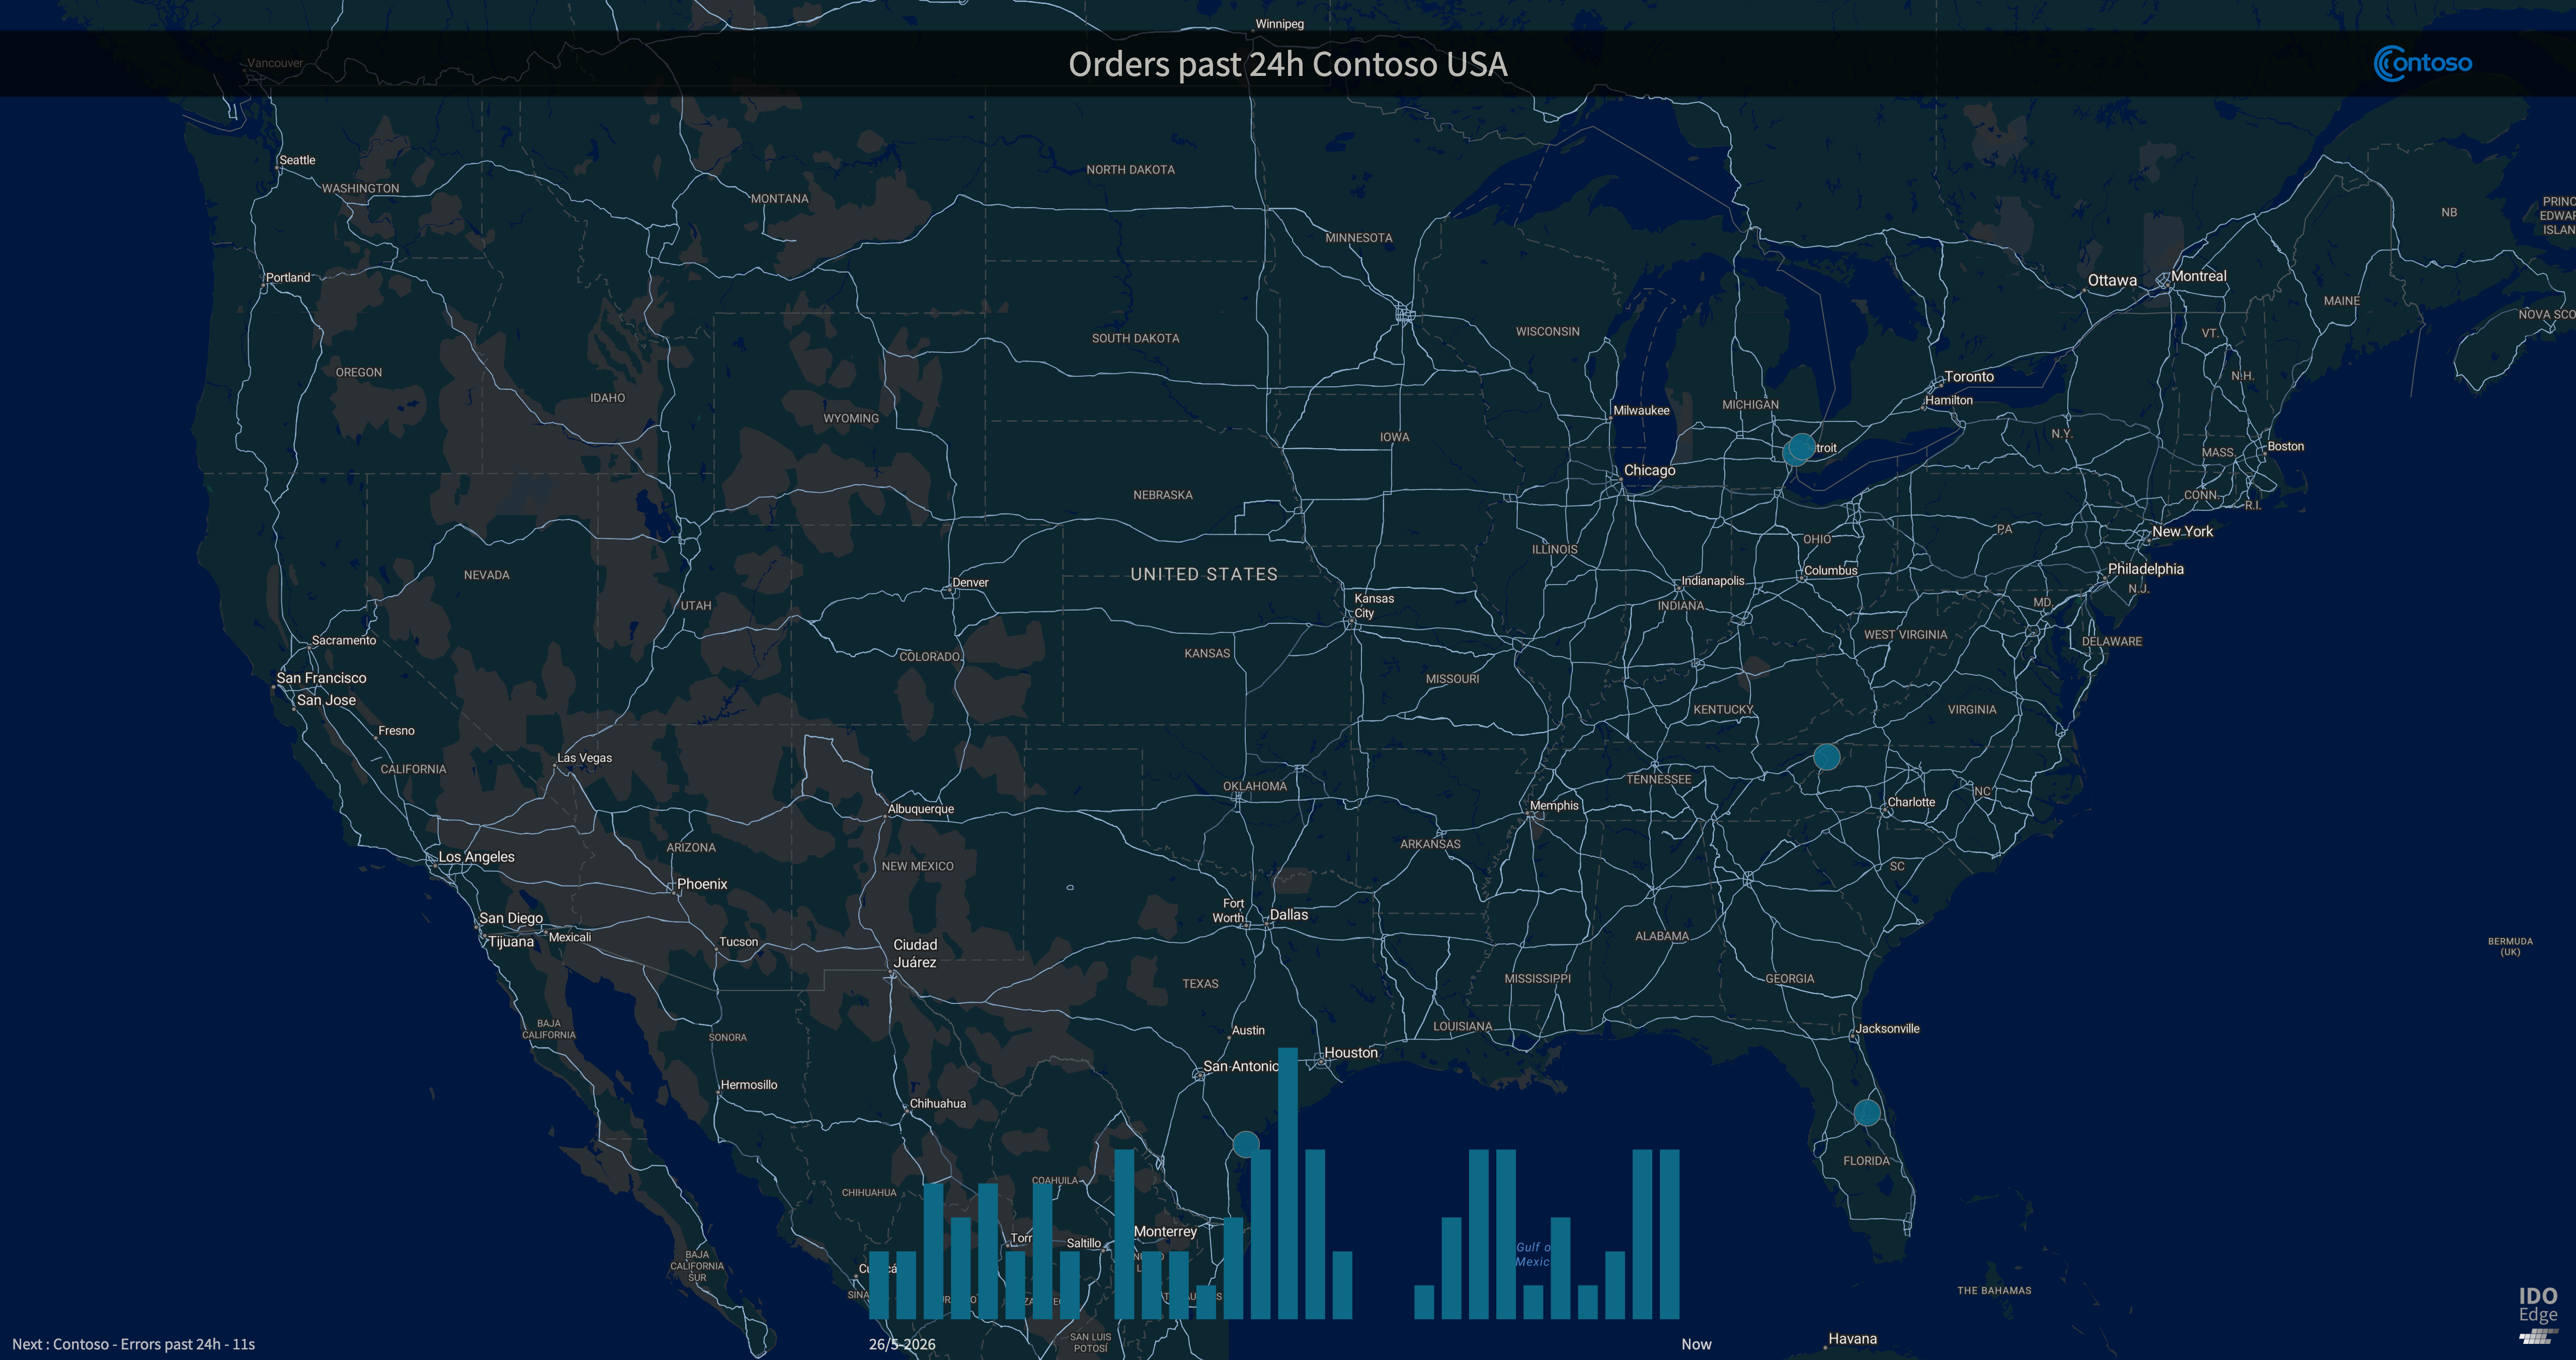
Transactions & conversions
Map-level visibility of transactions and conversion rates for selected periods, with regional breakdowns for quick action.
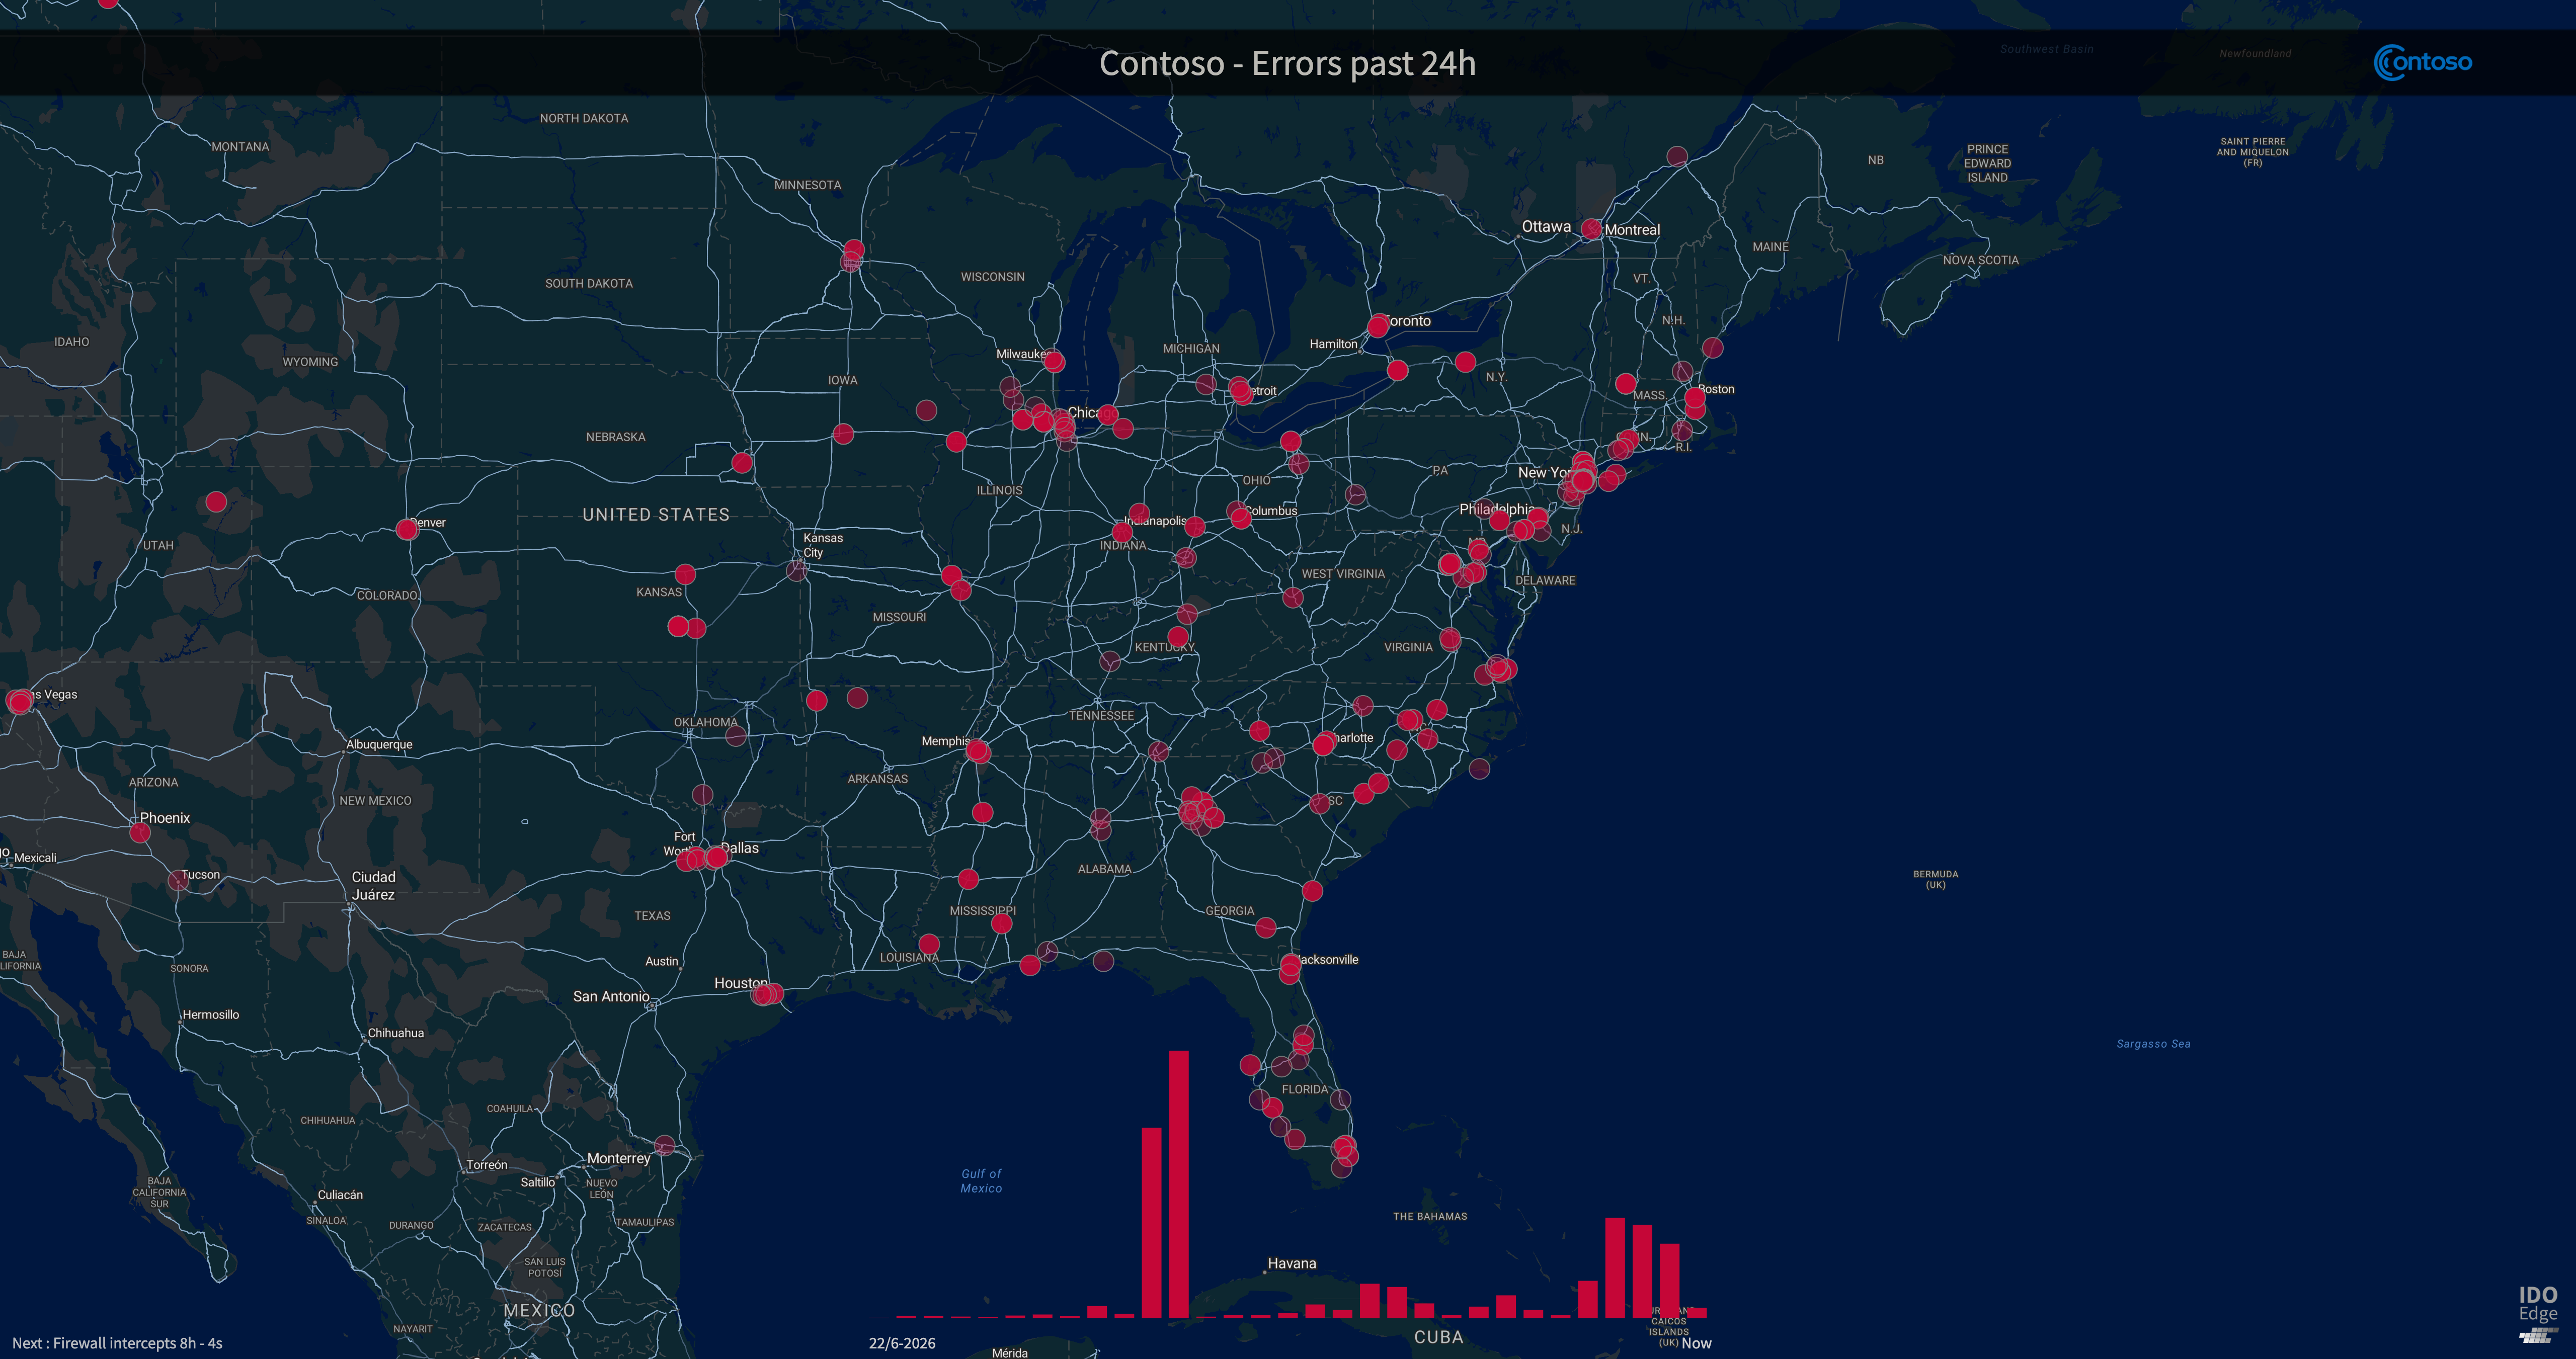
Error hot-spots
See error clusters by country or region to prioritise fixes and route work to the right teams.
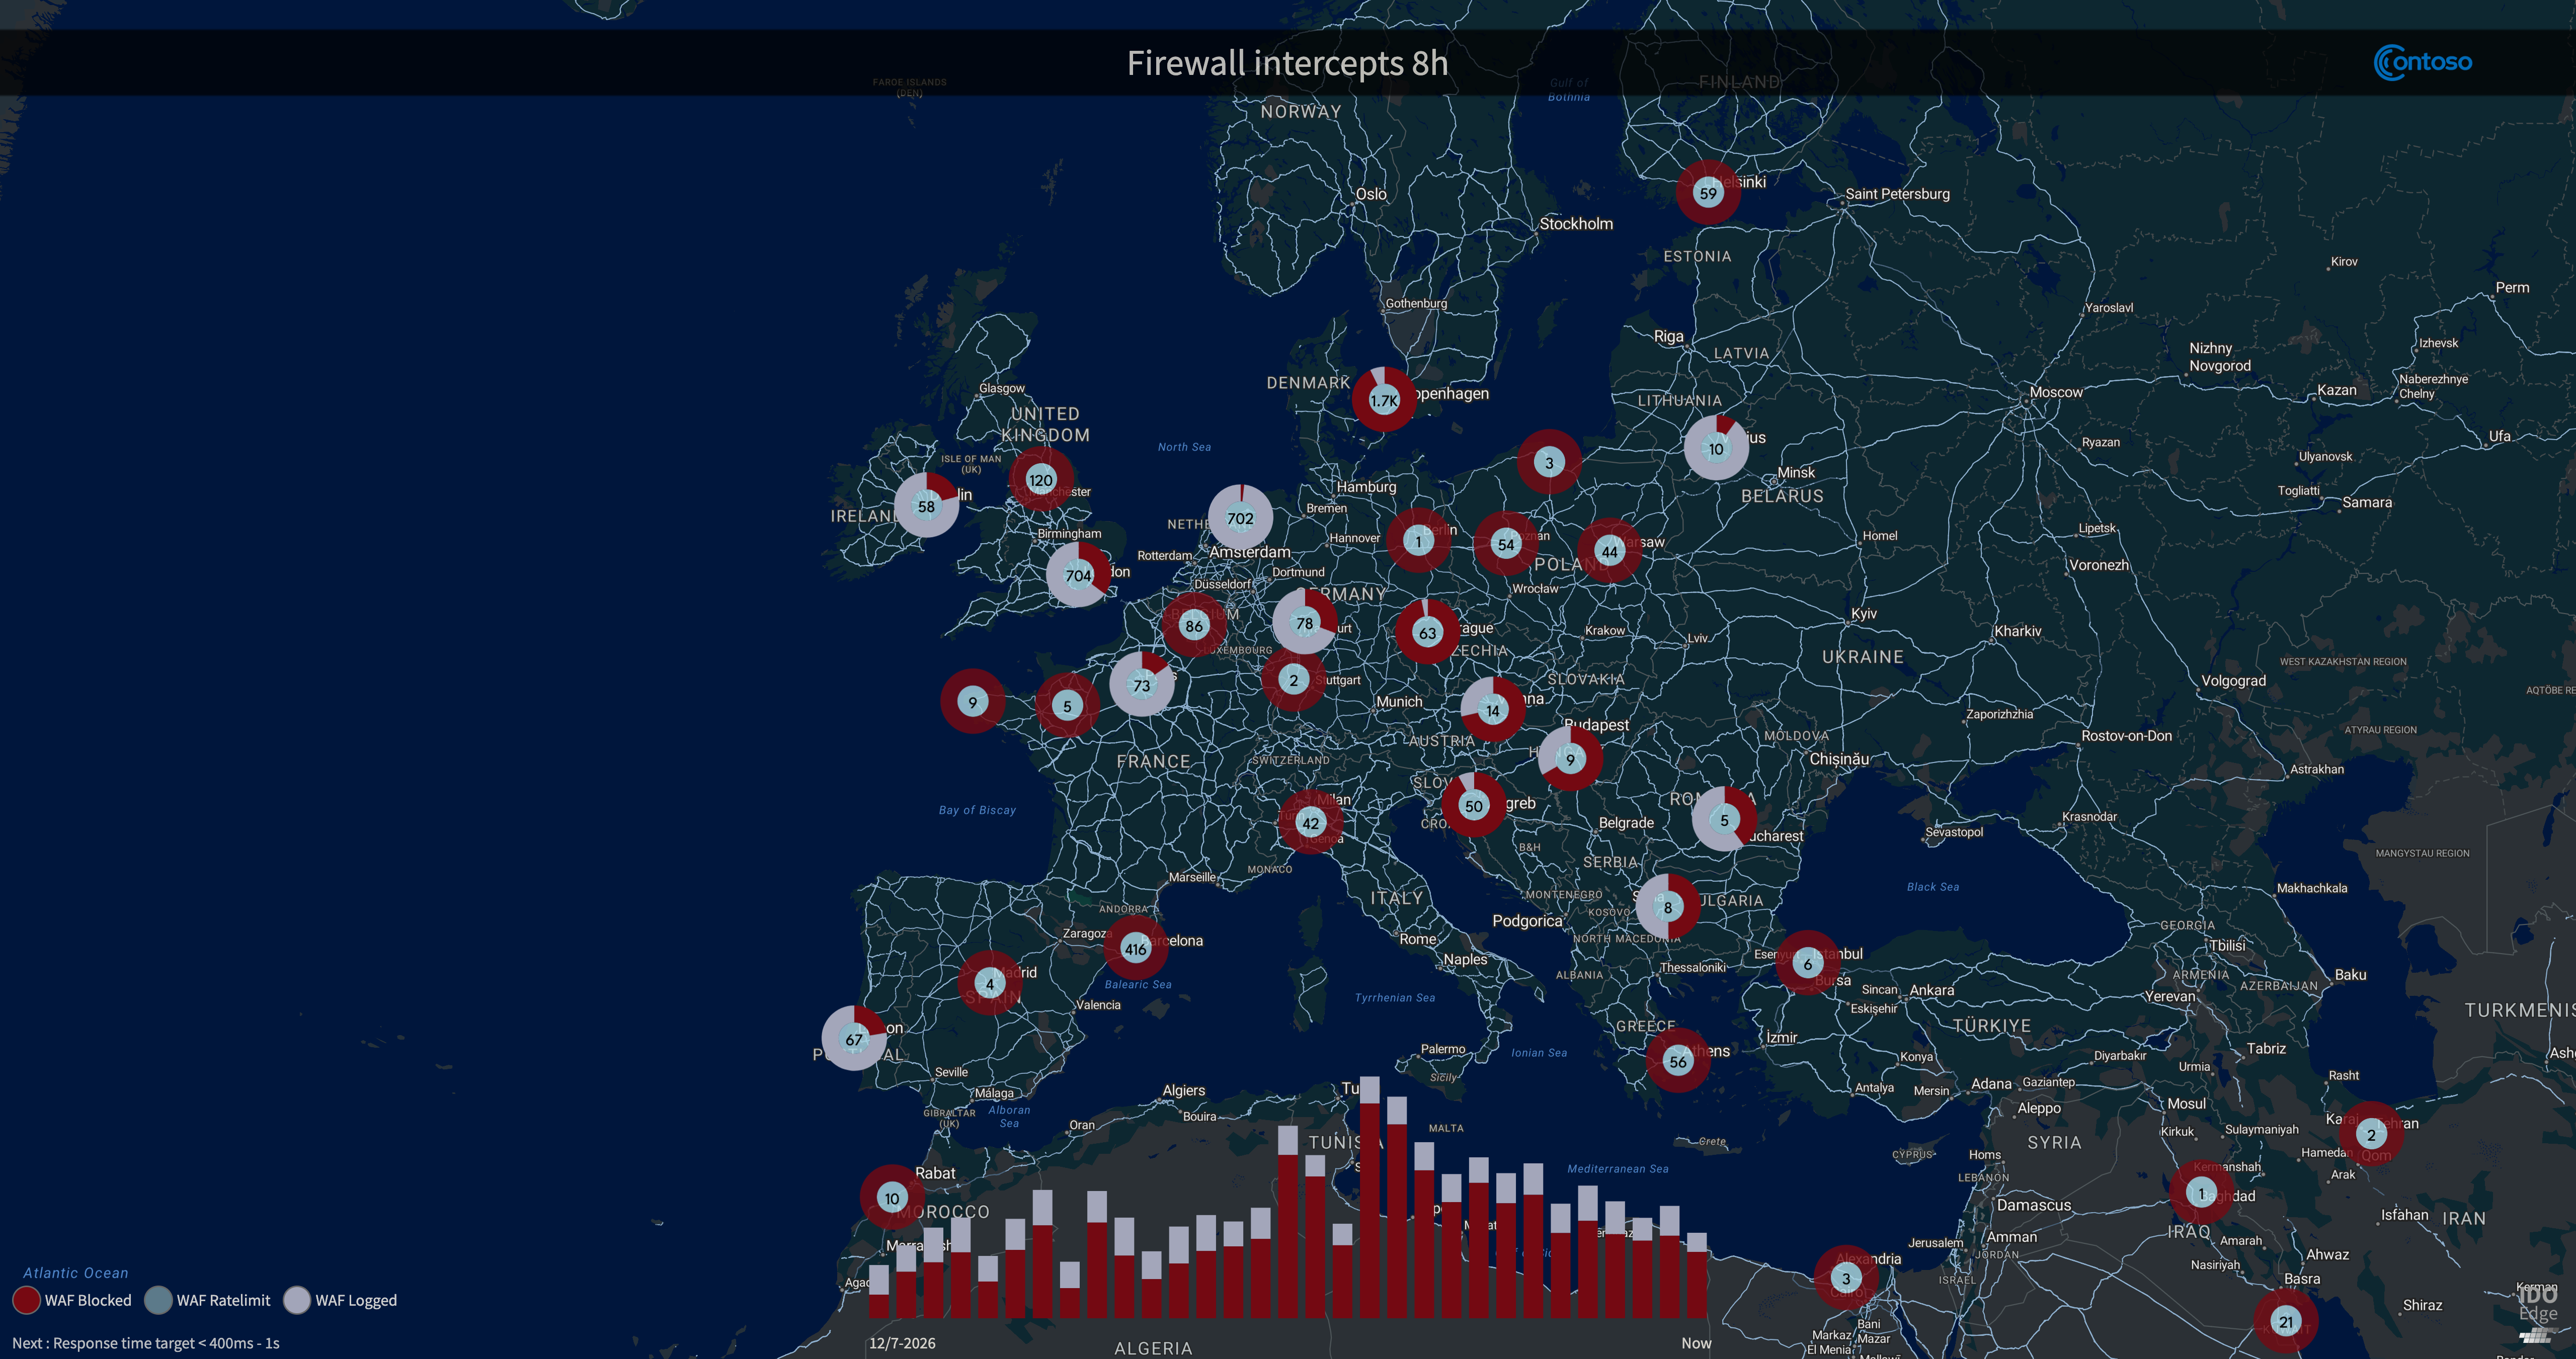
Security visualisations (WAF & RADR)
Live maps of WAF hits, RADR detections and bot activity so security can correlate threats with performance and capacity.
Also included
Scoped dashboards for stakeholders
Build separate dashboards per team, brand or region - scoped by domain and metric - so everyone sees what they own.
Multi-dashboard workspace
Maintain multiple dashboards across your organisation - from a LATAM ecommerce board to a global Security Ops map - all within IDO Edge.
Azure Marketplace deployment
Procured via Azure Marketplace, counting toward your MACC or Enterprise Agreement.
How it works
Build your first dashboard in three simple steps
Select scope
Choose domains or regions to include
Add widgets
Traffic, performance, transactions, errors and security events
Style & publish
Arrange on the map, save presets for teams, and share
Ready to make insight effortless?
Join enterprises worldwide using IDO Edge to turn raw data into visual stories everyone can use
Built for enterprise scale • Real-time insights